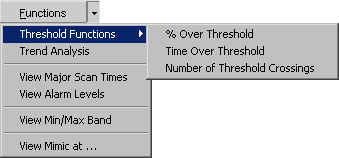
All three functions are used for statistical purposes. On selecting one of the functions, a line will appear over the entire viewing area of the graph, which represents the threshold value. This threshold can be adjusted to any desired threshold. The results will be updated as the threshold is altered. The selected threshold value is displayed on the bottom of the graph.
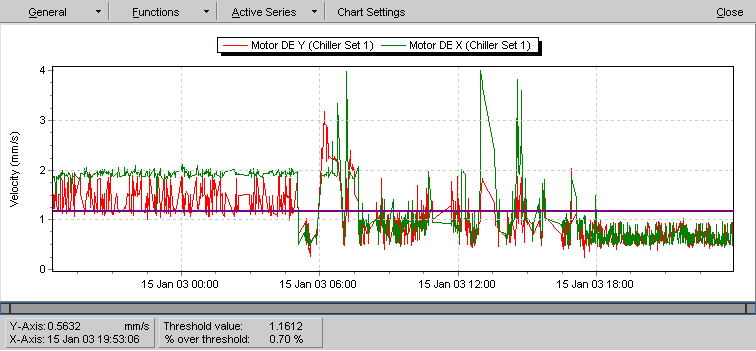
Displays the number of data points above the threshold as a percentage of the total shown.
Displays the total duration of the graph above the threshold.
Displays the number of times the graph crosses the threshold.
