 Click to view the
Mimics page
Click to view the
Mimics pageThe Analysis | Mimics page displays an easy to read schematic view of all the data readings for a device. Group boxes can be color-coded for easy association with the sensor points on the device from which the readings are taken (color-coding is setup in the Motornostix Admin application).
There are two ways you can get to the Mimics page:
From the Analysis | Alarms page or by
Navigating to the page.
In most instances you will probably get to the Mimics page by clicking on the Location hyperlink on the Analysis | Alarms page. This will take you to a Mimic of the device displaying the time and measurements that caused the alarm to be raised. Please see the Analysis | Alarms section for more information in this regard.
You can navigate to the Mimic by selecting the appropriate Client, Site, Division and Location drop–down boxes.
The status bar on the upper right will provide the name of the device being viewed:

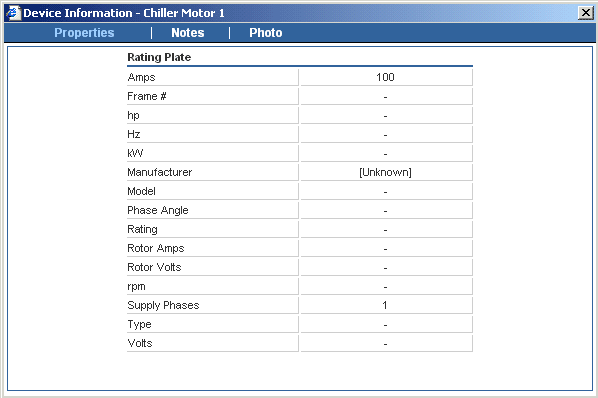
To ensure that you are viewing data form the correct device, Motornostix allows you to store a photograph of each device. This photo can be easily accessed from the Analysis | Mimics page by clicking on the schematic of the device. This presents the Device Information dialog. To view the photo, click the Photo tab.
 Click to view the
Device Information dialog

Data on the Analysis | Mimics page is essentially a "snapshot" of readings on that device. The date and time of the scan for which you are viewing data is displayed immediately above the device schematic diagram and data readout boxes:

Navigation controls appear on either side of the date and time stamp. These can be used to move incrementally to the Next (right arrow) or Previous (left arrow) scans to view later or earlier scan data. The on the far right (right arrow with line) is the Last button. This will take you to the most recent scan which will typically be less than a few minutes old.
It is often useful at a glance to know whether the device that you are viewing in real time is running or not. Between the Device and Load is an image of the coupling that is static if the Device is not running, but appears to be turning if the device is running:

On the bottom left of the Motor diagram is a box indicating which canary is attached to the motor:

If a reading exceeds the alarm threshold set for that variable, it will be shown in red. Alarm thresholds are shown as ToolTips when you move the mouse pointer over a given channel.
To view graphs from the Quick View Motors page, select the variables you want displayed in graphical form by clicking in the appropriate check boxes, and then click Trend Graph or Spectrum Graph.